IPFS Gateway Performance Measurements
The ProbeLab team has been busy building new IPFS Gateway performance measurements which are now live on our website at: https://probelab.io/ipfs/gateways.
This work was carried out as part of our ongoing effort to provide the IPFS community with insights into the health and performance of the network's public infrastructure (see Milestone 4 for the full scope of the work).
What's New
We've deployed our Tiros measurement suite to continuously probe a set of public IPFS HTTP gateways and the inbrowser.link Service Worker Gateway, measuring (among other things) the Time to First Byte (TTFB) as the key indicator of how quickly a gateway begins delivering content to users.
The gateways we currently probe are:
dweb.linkipfs.ioipfs.filebase.ioipfs.orbitor.devw3s.linkinbrowser.link(Service Worker Gateway)
If you want us to include another gateway in this list, reach out to us! (see below)
Measurement Methodology
Understanding how we measure is important for interpreting the results correctly, here we'll walk through the setup in detail.
The Tiros Measurement Suite
All measurements are collected using our Tiros tool. For the traditional HTTP gateways, Tiros issues standard HTTP requests. For the inbrowser.link Service Worker Gateway, Tiros runs a headless Chromium instance that loads the page and measures the time until the first byte of actual content is seen by the browser. This distinction is critical for understanding the performance differences between gateway types (more on that below).
Request Path
Tiros makes requests using the path-based endpoint format: /ipfs/{cid} as opposed to the subdomain format (https://{cid}.{gateway_domain}). This is an important detail because some gateways internally redirect path-based requests to their subdomain equivalent for security reasons. These redirects add round-trips that show up in our TTFB measurements. We'll come back to this when discussing w3s.link.
Segmentation Dimensions
The data is segmented along several dimensions to allow fine-grained analysis:
Region: We run probes from four AWS regions to capture geographic latency differences:
eu-central-1: Europe (Frankfurt)us-east-2: US East (Ohio)us-west-1: US West (N. California)ap-southeast-2: Asia Pacific (Sydney)
The location from where we probe is important to know when interpreting the latency results because it could be that results are skewed if gateway infrastructure is co-located with our probes.
Cache Status: For each CID, Tiros sends two consecutive requests: the first aims to trigger an uncached response, and the second aims to trigger a cached response. We determine cache status by parsing the response headers cf-cache-status, x-filebase-edge-cache, and x-cache. This lets us separate cold retrieval performance from warm cache performance.
CID Source: We use two types of CIDs:
- Controlled CIDs: Random 1 kB data blobs that ProbeLab hosts on a self-operated Kubo node in
us-east-1. Because we know these CIDs exist and we control the source, they provide a reliable performance baseline under known conditions. - Organic CIDs: Real CIDs discovered in the wild by our Bitswap Sniffer tool, which observes live Bitswap traffic on the network. Measuring retrieval performance for these CIDs serves as a proxy for what a typical user would experience when interacting with IPFS gateways. Note that we cannot guarantee organic CIDs are still available at retrieval time, which is why they're useful for capturing real-world conditions but may also produce more variance.
What You'll Find on the Dashboard
The dashboard includes the following new sections:
HTTP Gateway Time to First Byte: Daily P50 and P90 TTFB charts across all probed HTTP gateways, with filters for region, cache status, CID source, and percentile.
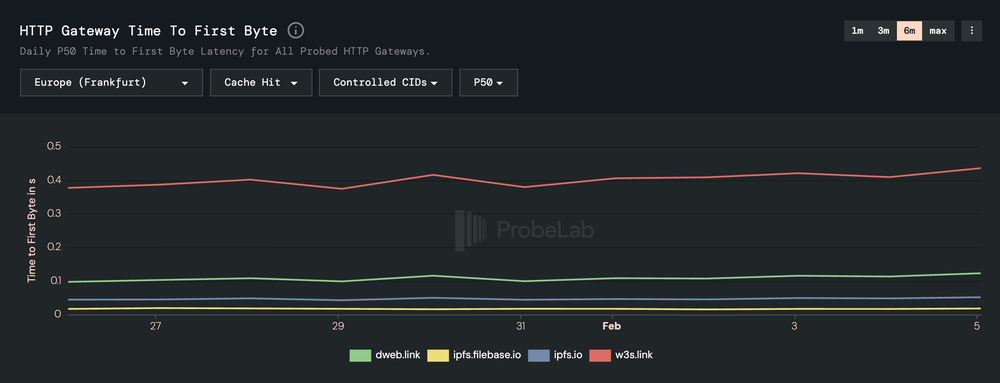
Source: https://probelab.io/ipfs/gateways/#chart-ipfs-http-gateway-ttfb-ts
Service Worker Gateway TTFB: Dedicated TTFB measurements for the inbrowser.link service worker gateway.
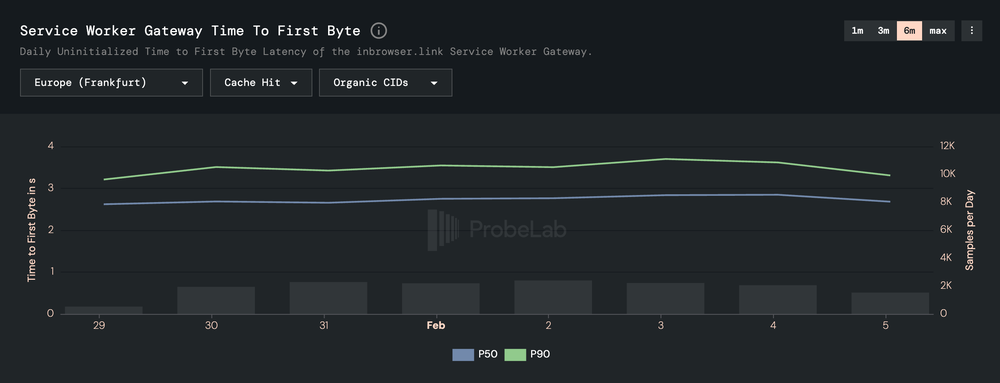
Source: https://probelab.io/ipfs/gateways/#chart-ipfs-service-worker-gateway-ttfb-ts
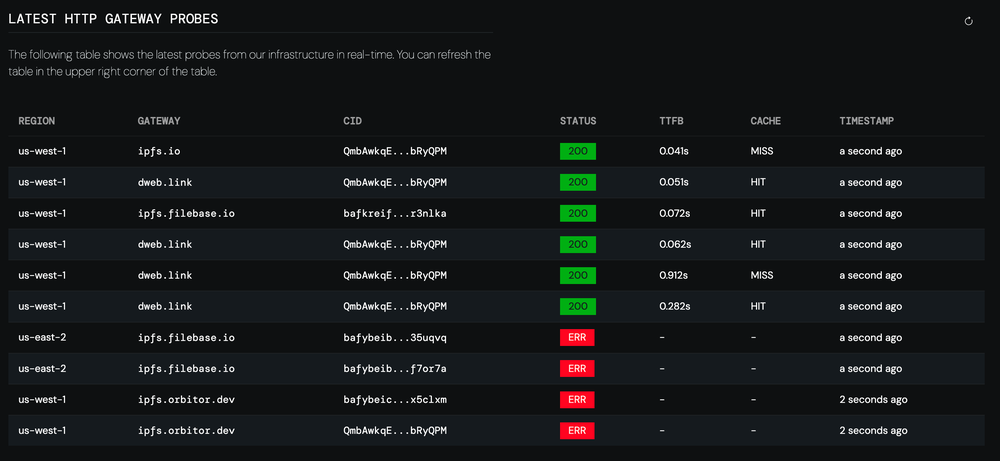
Live Probe Table: A real-time view of the latest probes from our infrastructure, showing region, gateway, CID, HTTP status, TTFB, and cache status of our HTTP gateway probes (not showing service worker gateway probes). Click on any row to see the full probe details including the IPFS path, content type, redirect count, CAR validation status, and exact timestamp.
Interpreting the Results: Why Some Gateways Appear Slower
If you look at the charts, you'll notice significant performance differences between gateways. These differences are not necessarily a sign of one gateway being "worse" than another but instead they reflect different trade-offs.
Why w3s.link Shows Higher TTFB
In our measurements, w3s.link consistently shows higher TTFB than gateways like ipfs.io. The differences are typically around 300-350 ms at P50, compared to under 100 ms for the fastest gateways (for cache hits with organic CIDs in the Europe/Frankfurt region).
The reason is subdomain redirection. When Tiros sends a path-based request to w3s.link (e.g., https://w3s.link/ipfs/{cid}), the gateway redirects the request to the corresponding subdomain URL (e.g., https://{cid}.ipfs.w3s.link/). This redirect adds one or more additional round-trips before content delivery begins, and those round-trips are included in our TTFB measurement.
Importantly, this is a deliberate security feature, not a bug. Subdomain gateways provide stronger origin isolation where each CID gets its own web origin, which prevents cross-content attacks (e.g., one piece of IPFS-hosted content accessing cookies or storage from another). This is the recommended security practice for IPFS gateways. The trade-off is the additional latency from the redirect. In practice, for applications that can use the subdomain URL directly (bypassing the redirect), this penalty disappears.
Why the Service Worker Gateway Appears Much Slower
The inbrowser.link Service Worker Gateway shows TTFB values around 2.5-3.5 seconds at P50 which is an order of magnitude higher than the traditional HTTP gateways. This is expected and, again, reflects a fundamentally different architecture rather than poor performance.
Here's what's happening under the hood. When Tiros measures the Service Worker Gateway, it opens a headless Chromium instance and navigates to https://inbrowser.link/ipfs/{cid}. The measured TTFB includes the entire bootstrap sequence:
- Downloading the service worker code from the server
- Initializing and registering the service worker in the browser
- Various redirects to configure proper subdomain isolation in the browser context
- Content retrieval itself, which races two parallel resolution paths:
- A request to a trustless HTTP gateway (
trustless-gateway.link) - A delegated routing request plus direct retrieval from the actual peer
- A request to a trustless HTTP gateway (
- Content verification where the service worker verifies the integrity of downloaded bytes before delivering them to the browser
That's a lot of work before the first byte of actual content reaches the page. But there are three important things to keep in mind:
- Content verification: Unlike traditional gateways where you trust the gateway operator, the service worker gateway cryptographically verifies the downloaded content client-side. You don't need to trust anyone.
- Origin isolation: The service worker ensures proper subdomain origin isolation, similar to
w3s.linkbut enforced entirely in the browser. - Amortized startup cost: Our measurements capture the uninitialized (cold-start) case. Once the service worker is installed, subsequent requests skip steps 1-3 entirely and resolve significantly faster. The dashboard title explicitly notes this: "Daily Uninitialized Time to First Byte."
So while the raw numbers look high compared to traditional gateways, the service worker gateway offers stronger security guarantees, and its steady-state performance (after initialization) is much better than what our cold-start measurements show.
We Want Your Feedback!
This dashboard is built for the community, and we want to make sure it's actually useful to you. Here are some questions we'd love to hear your thoughts on:
- Are there gateways you'd like us to add to the probe list? We're open to expanding coverage.
- Are there additional metrics beyond TTFB that would be valuable?
- Is there anything confusing or unclear about the dashboard or the methodology?
If you operate a gateway and would like it included in our measurements, or if you'd like deeper analysis for a specific use case, please reach out. We're happy to collaborate.
Get in Touch
Check out the full dashboard at https://probelab.io/ipfs/gateways/ and let us know what you think!
Feel free to share feedback directly in this thread, or reach out to the ProbeLab team through our contact page.
Related Posts

Optimistic Provide: How We Made IPFS Content Publishing 10x Faster
How a statistical approach cut IPFS content publishing times by over one order of magnitude.

Peering into Privacy: A Deep Dive into the Monero Network Topology
Mapping Monero's P2P network: 16,000 nodes, one dominant provider, and a lot of spy nodes.

ProbeLab's 2025 Review and 2026 Outlook
What we've achieved in 2025 and what we're targeting in 2026